Turn shipping into your competitive advantage
To bring you the latest insights around e-commerce logistics we surveyed over 9000 online shoppers. Learn about their delivery expectations and discover how you can outgrow your competitors by improving your delivery experience in 2023.
Key Insights
About the study
Looking for ungated and unlatered e-commerce statistics? Look no further
Gender
Age
Location
If the customer is always right, 9000 of them can’t be wrong.
We quizzed a HUGE number of online shoppers on their shipping experiences & expectations in 2023.
We asked customers from Europe and the US to see how preferences differ across borders.
Plus, we’ll show the different shopping habits between Gen Z, Millennials, Gen X, and Boomers.
As well as year-on-year changes per country and per generation.
ps. you can interact with some data, keep your eyes
E-commerce statistics in the last decade
Before we dive in, let’s take a look at what’s happened in the last decade…
2014-2019
Stable
and manageable growth

2020
Hyper-growth
caused by the outbreak of the pandemic

2021
56% increase
in sales in 2 years (US)

2022
Hyper-growth curtailed
as pandemic “ended”

2023
Fears of a recession
but with growth still likely

How often do customers shop online?
Average orders per month
2022 Country Breakdown +


2.2

2.0

1.8

1.8

1.7

1.6

1.6

1.6

1.5
How much did customers spend on their last order?
Average price of last online order
2022 Country Breakdown +
174.0
161.4
144.0
141.9
126.8
123.5
105.3
99.8
98.6
Maximum days to wait for a refund after returning
2022 Country Breakdown +
6.6
5.9
5.5
5.5
5.3
5.1
4.9
4.7
4.3
How To Get X Result They Really Want In Y
Time Which Sounds Short
Lorem ipsum dolor sit amet. In adipisci magnam eum ratione deserunt aut consectetur inventore! Ut natus amet rem quisquam animi qui architecto dolores sed totam voluptatem ut error molestiae. Ab rerum repellendus et esse fugiat.
Get started for free
E-commerce statistics comparing shipping across Europe & the US
Expanding your business to new markets is at the top of most online stores’ priority lists. To be successful in a crowded market, you need to know the specific habits and preferences in different countries and regions.
Here’s a cool example for you…
Did you know?
In France, shoppers have a strong preference for picking up their parcels at service points. And, in Spain and Italy, customers are happiest when they can select their own specific delivery date.
Taking these small nuances into consideration will have a huge impact on your business.
Maximum amount willing to pay for shipping
2022 Country Breakdown +
$7.5
$9.2
$12.8
€4.8
€4.9
€5.8
£4.7
£5.1
£6.8
€4.6
€5.3
€6.9
€4.5
€4.5
€5.5
€4.4
€4.6
€6.2
€4.1
€4.8
€6.5
€3.8
€4.6
€6.3
€3.5
€4.0
€5.5
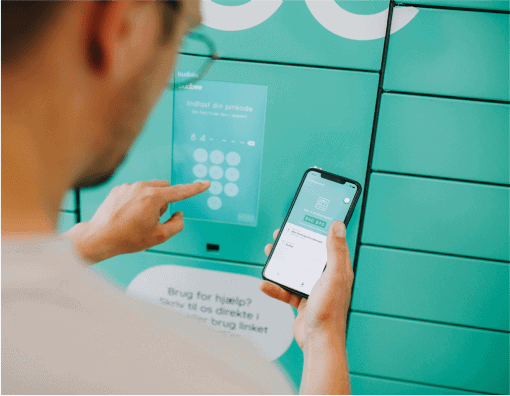
Which delivery methods will be most popular in 2023?
Let’s take a look at the most popular delivery methods in each country
ps. you can interact with some data, keep your eyes
How do customers want to receive tracking updates?
Country Breakdown +
|
|
|
|
|
|
|
|
|
|
|---|---|---|---|---|---|---|---|---|---|
| 64% | 71% | 68% | 71% | 75% | 69% | 60% | 66% | 67% | |
| SMS | 58% | 20% | 36% | 27% | 39% | 39% | 32% | 38% | 51% |
| Tracking app from the carrier | 31% | 31% | 32% | 41% | 34% | 34% | 27% | 26% | 39% |
| 18% | 21% | 20% | 26% | 12% | 12% | 42% | 39% | 9% | |
| 9% | 5% | 3% | 5% | 7% | 7% | 4% | 6% | 12% | |
| Telegram | 3% | 5% | 4% | 4% | 2% | 2% | 7% | 7% | 6% |
| Telegram | 1% | 3% | 4% | 2% | 1% | 1% | 1% | 3% | 3% |
How To Get X Result They Really Want In Y
Time Which Sounds Short
Lorem ipsum dolor sit amet. In adipisci magnam eum ratione deserunt aut consectetur inventore! Ut natus amet rem quisquam animi qui architecto dolores sed totam voluptatem ut error molestiae. Ab rerum repellendus et esse fugiat.
Get started for free
E-commerce statistics comparing generations
It’s not only important where you are shipping to but also to whom.
Let’s take returns as an example…
The end of free returns…
The concept of “bracketing” aka “buy-and-try” is very costly for businesses. The result: more and more big retailers putting an end to free returns (e.g. Zara, H&M, and Uniqlo). Will this set a new direction for returns in the future?

Maximum amount willing to pay for returns
Maximum waiting time for refund after returning
Final Thoughts
Getting to know your customers is integral. After all…
The customer is always right
Every transaction a customer makes is driven by emotion. This means most insights we get from our customers are based on their emotional wants.
We’ve all witnessed a customer demanding a full refund for a faulty item. Emotions are high so the customer is speaking about their emotional want.
But what do they truly need?
To be heard..
All of the above. Though ultimately what they truly need is the product.
It’s important for all businesses to differentiate a customer’s emotional wants vs. their genuine need. The data above is a great foundation to start with. However, you have to delve further to really get to know your customers.
Dive deeper into your customers’ wants and needs with Sendcloud’s Consumer Research Report 2023. The report covers checkout, tracking, returns, international shipping, green shipping, and more.